GraalVM Dashboard
GraalVM Dashboard is a web-based tool to view aspects of dynamic and static compilations in GraalVM.
Dashboard Data Dump
To use this tool, we need to dump data first during the generation of a native image. There are three categories of command line options of native-image to use.
Options
Dump Path
-H:DashboardDump=<path> specifies the path of the dump file.
Scope of Dump Data
Options to select the scope of data to dump.
| Option | Description |
|---|---|
-H:+DashboardAll | Dump all available data |
-H:+DashboardHeap | Dump the breakdown of the image heap |
-H:+DashboardCode | Dump the breakdown of the code size per method |
-H:+DashboardPointsTo | Dump the points-to analysis information |
Dump Format
Options to select the output format of dump data.
| Option | Description |
|---|---|
-H:+DashboardBgv | Dump in BGV format (default) |
-H:+DashboardJson | Dump in JSON format |
-H:+DashboardPretty | Dump in JSON pretty print format |
Usage
The command below generates all dashboard dump data in BGV format.
native-image -H:DashboardDump=dashboard.dump -H:+DashboardAll
View Dashboard
After the dump file is generated, it can be uploaded to GraalVM Dashboard.
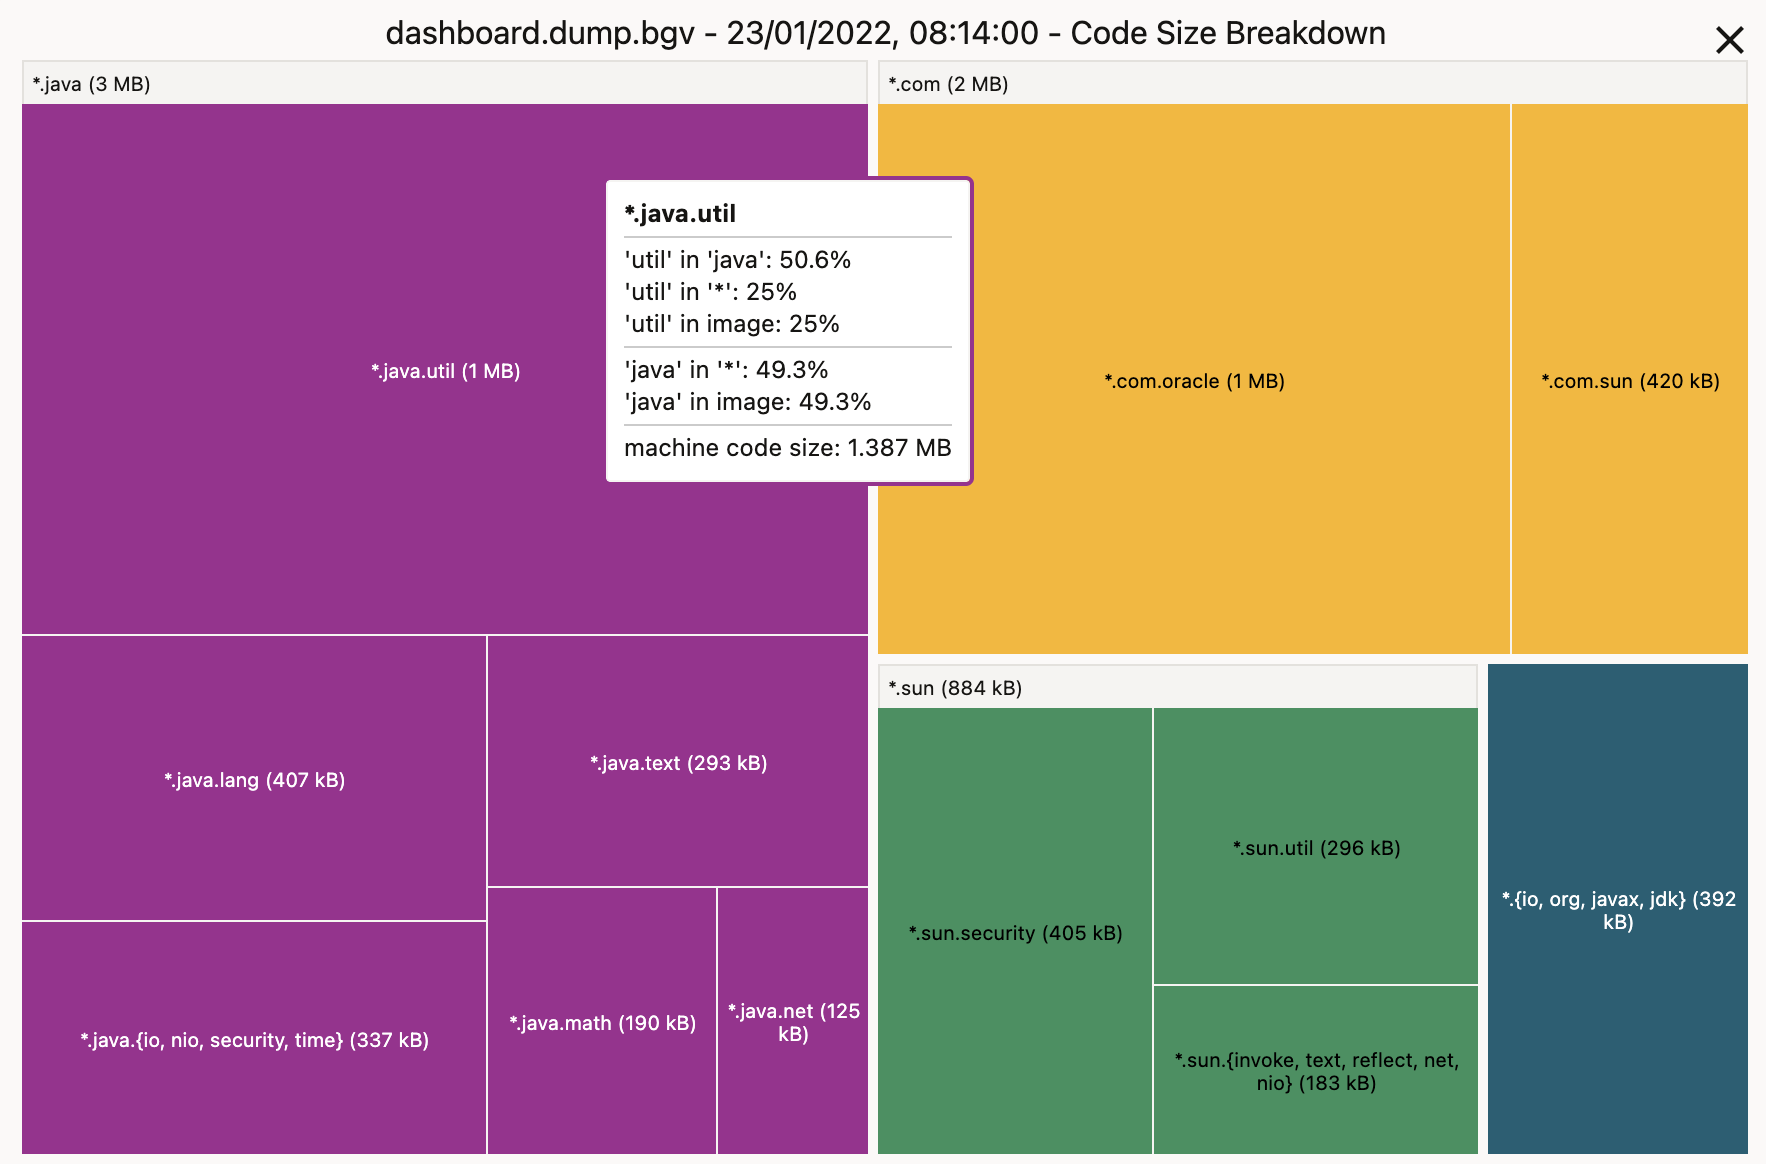
Code Size Breakdown
The Code Size Breakdown displays the breakdown of the code by packages, classes and methods that were included into a native image.
Data is grouped by packages. Clicking on one block drills down into details of selected package.
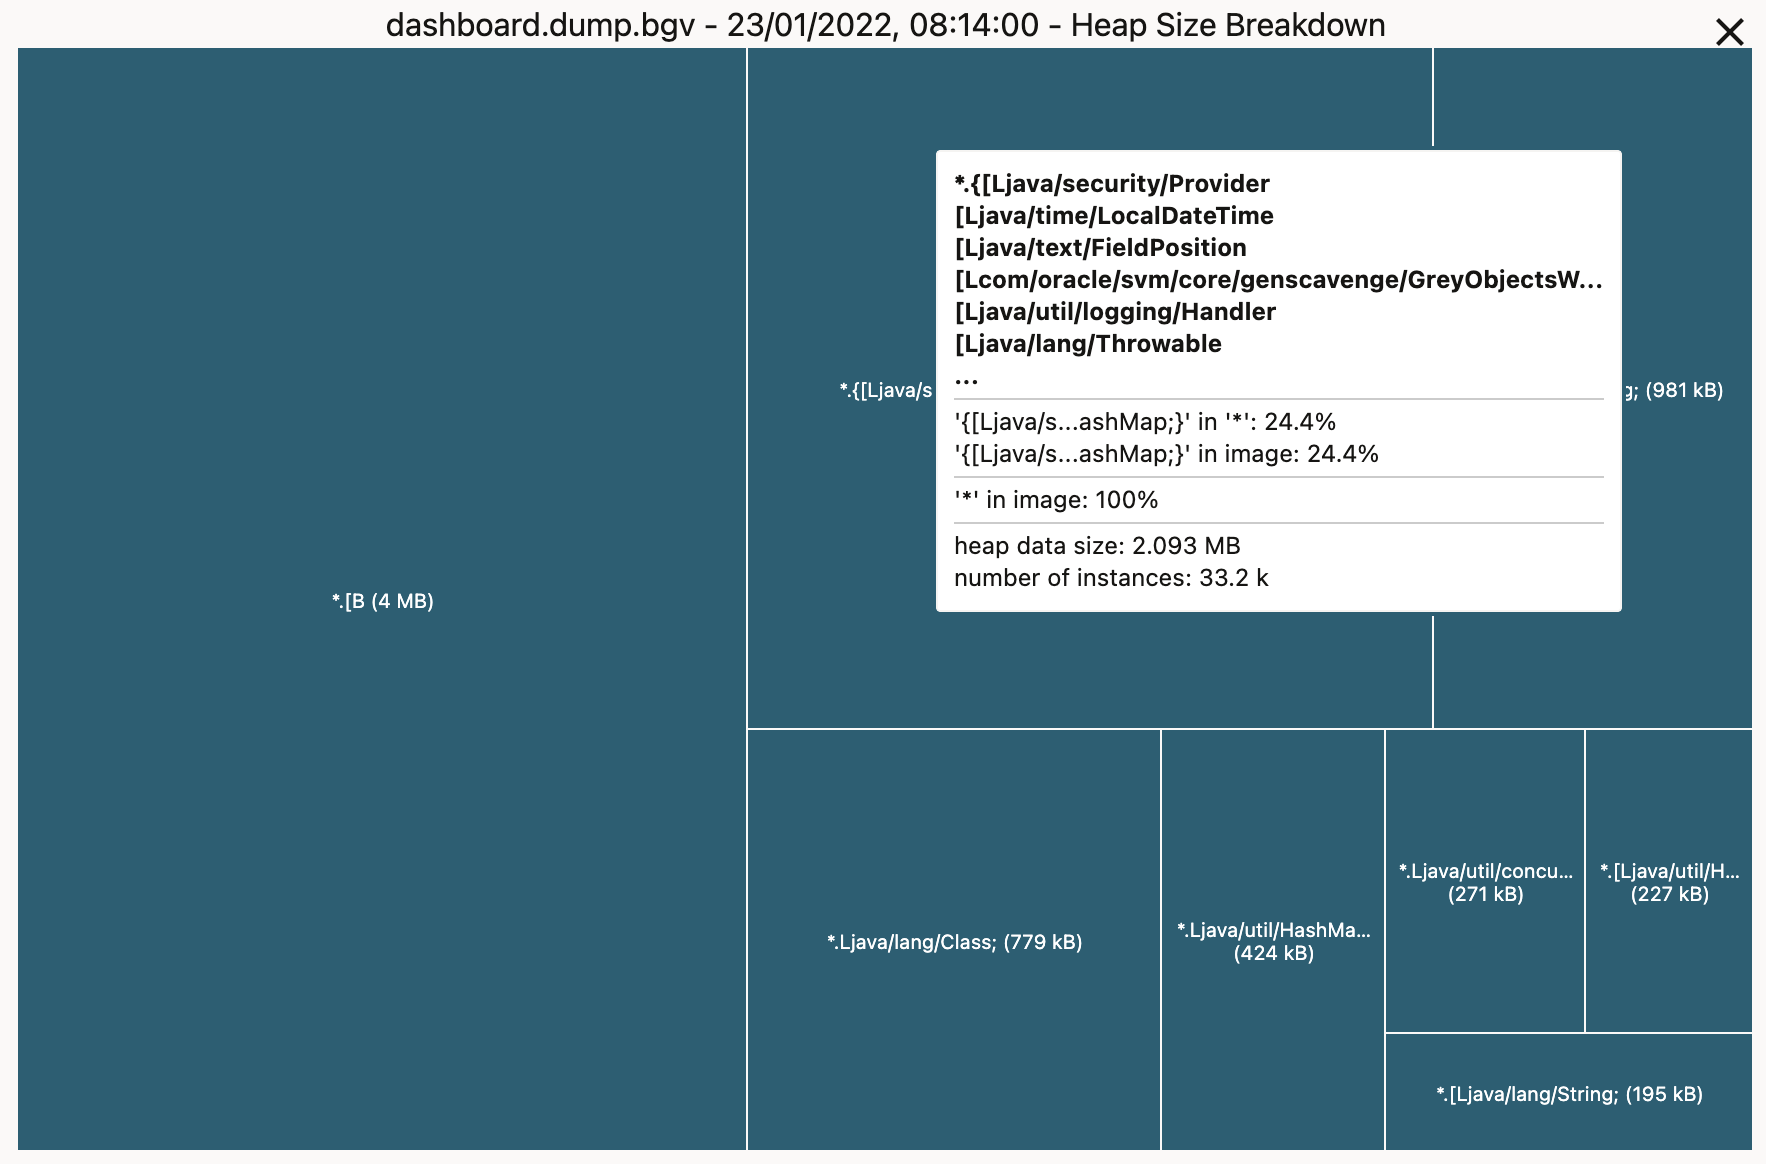
Heap Size Breakdown
The Heap Size Breakdown displays a visual summary of the sizes of the preallocated objects of different classes included into a native image heap.
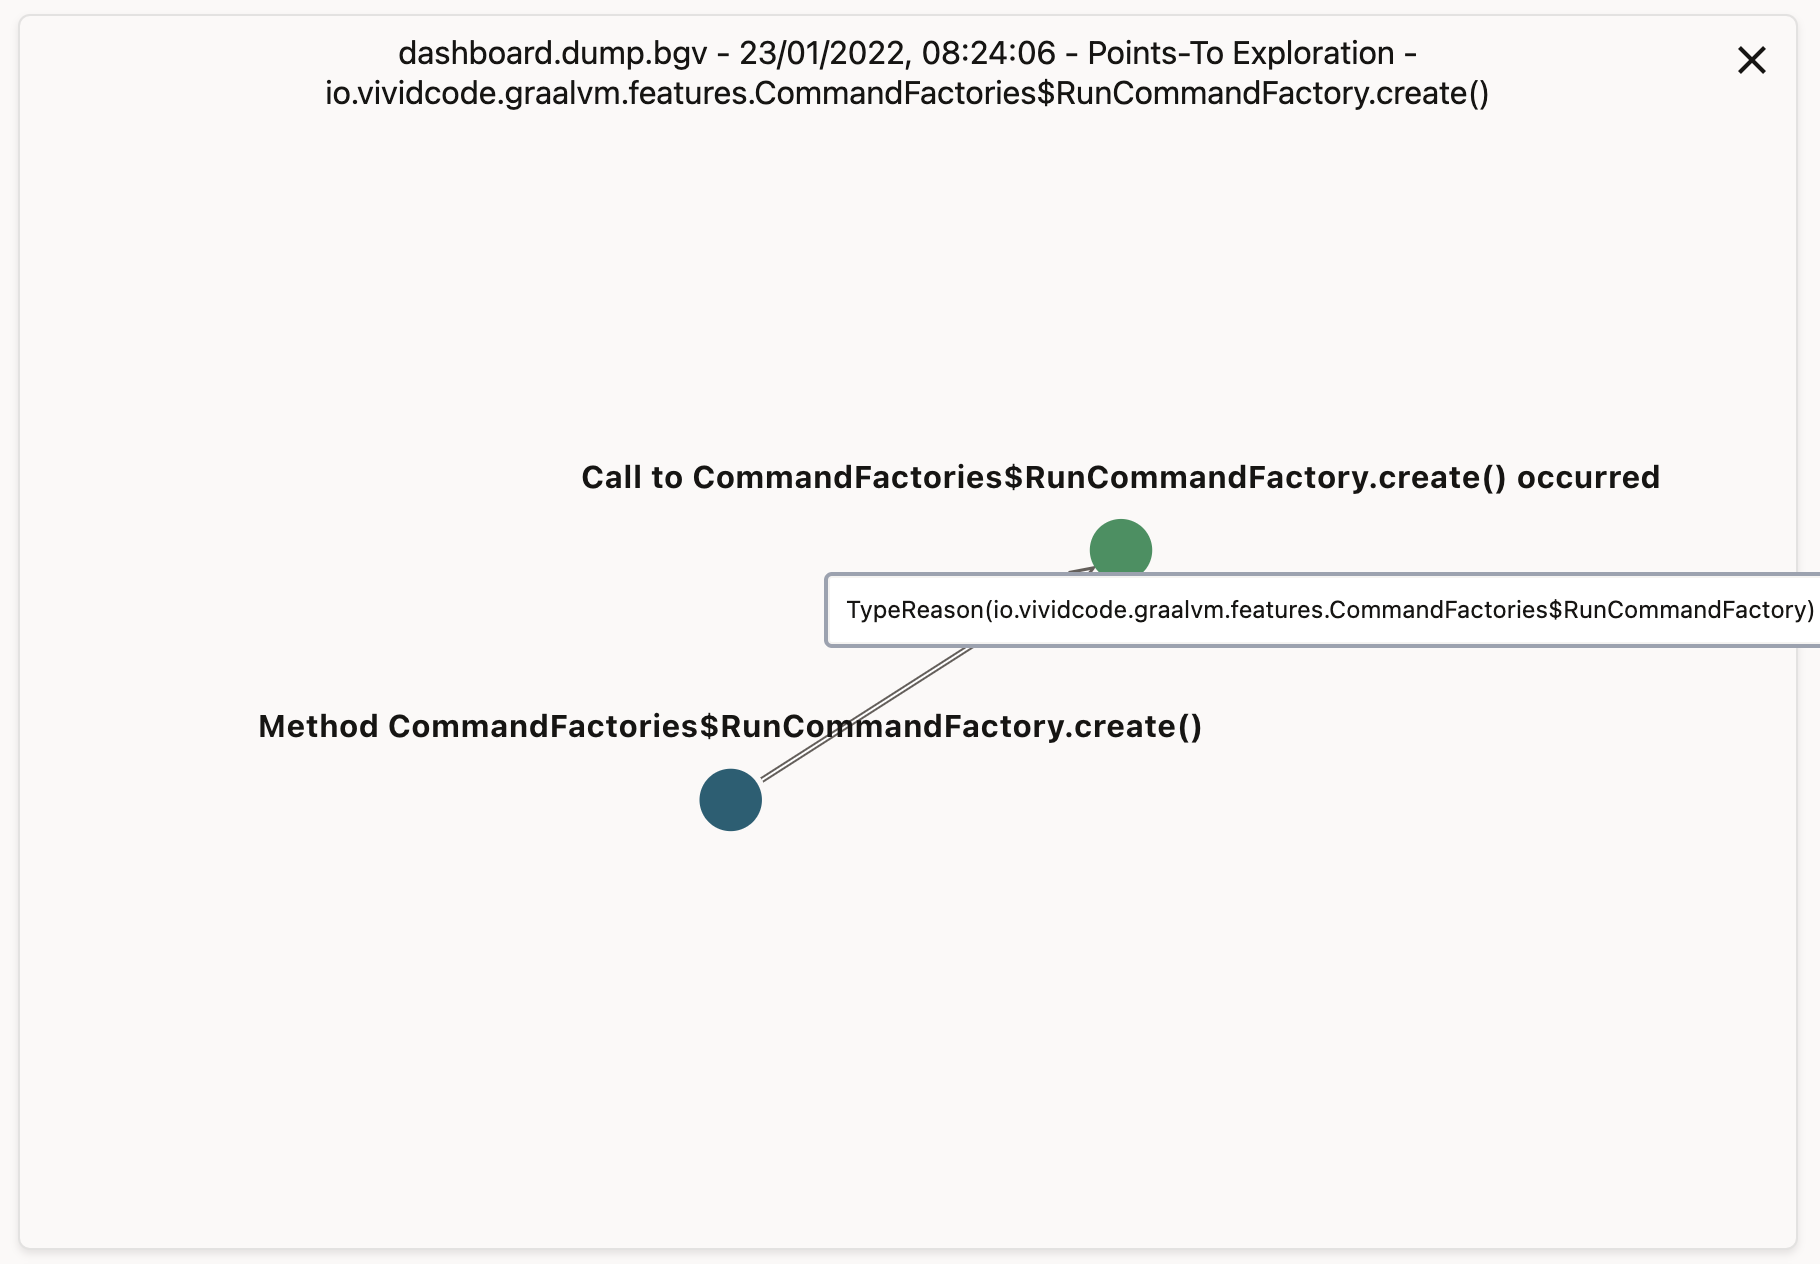
Points-to Exploration
The Points-to Explorer allows exploring the points-to analysis process of a native image to find out why a certain method was included.
In the Code Size Breakdown, when navigating to a method, Points-to Explorer will be displayed.